Thursday, April 19, 2012

U.S. barrier packaging market to grow to 8.7 billion lbs in 2016


The total U.S. barrierpackaging market equaled 8.1 billion lbs in 2011 and should grow at a compound annual growth rate (CAGR) of 1.5% over the next five years, reaching 8.7 billion lbs in 2016.

Learn about the important segments of the packaging industry, namely plastic barrier packaging and the plastic resins that supply these barriers. Also learn about the technological, economic, political, and environmental considerations in the U.S. barrier packaging polymer industry. Profiles of many supplier companies are provided as well...
Use this report to:
  • Learn about one the most important segments of the packaging industry, the plastic barrier packaging segment
  • Learn about many developments over the past generation in barrier packaging
  • Find out more about the four basic barrier packaging materials which are widely used: PVDC, nylon, EVOH, and metallized films
  • Understand the barrier packaging resin industry structure, with emphasis on major domestic producers and suppliers, horizontal and vertical integration, market and product entry, and differentiation factors.
To provide further information about this report we offer a Complimentary Introduction, available from our Website. To download, simply click here, go to the Table of Contents tab, add the complimentary introduction to your cart, and confirm your order.


U.S. PACKAGING BARRIER RESIN MARKET VOLUME ESTIMATE BY TYPE, 2011 AND 2016
(MILLION LBS)


Source: BCC Research

Bookmark and Share

Global Markets for Sterilization Technologies to Grow to $5.3 Billion by 2016

Global sales of sterilization capital equipment and filtration consumables were $3.3 billion in 2010 and $3.8 billion in 2011. This market is expected to grow to nearly $5.3 billion by 2016, a compound annual growth rate (CAGR) of 7%.

Learn about the global sterilization industry, with descriptions of the trends and developments for each type of sterilization technology. The most active suppliers, with regard to relative market share, marketing strengths and forces that promote or hamper growth of technologies are provided as well...


Use this report to:
  • Learn about the key processes of filter, heat, chemical and radiation sterilization
  • Identify and evaluate market and driving forces, in particularly regulatory impacts effecting market size
  • Analyze regional sales for the Americas; Europe, Middle East, Russia and Africa (EMRA); and Asian markets
  • Identify the sterilization business in terms of the types of companies and their positions in the market.  
To provide further information about this report we offer a Complimentary Introduction, available from our Website. To download, simply click here, go to the Table of Contents tab, add the complimentary introduction to your cart, and confirm your order.

SUMMARY FIGURE
GLOBAL MARKET FOR STERILIZATION EQUIPMENT AND CONSUMABLES BY REGION, 2011 AND 2016
(%) 
Source: BCC Research
Bookmark and Share

Wednesday, April 18, 2012

Global market value of optical coatings to grow to $10.1 billion by 2016

The global market value of optical coatings reached $5.9 billion in 2010 and nearly $6.7 billion in 2011. It is expected to reach $10.1 billion by 2016, a compound annual growth rate (CAGR) of 8.8%.

Learn about optical coating market conditions and opportunities in regional areas around the globe. The report also considers the potential new high margins coatings applications that will emerge in the next five years. Comprehensive company profiles are also discussed...

Use this report to:
  • Receive an overview of markets and opportunities for optical coatings in telecommunications, transportation, defense, photography, electronics, and medical markets
  • Receive information on product segments, various technology options and current application markets as well as likely future opportunities
  • Receive information on government regulations, foreseeable future developments and forecasts about the market over a five year period
  • Receive information on industry structure and various company profiles.

To provide further information about this report we offer a Complimentary Introduction, available from our Website. To download, simply click here, go to the Table of Contents tab, add the complimentary introduction to your cart, and confirm your order.

GLOBAL VALUE FOR OPTICAL COATINGS
($ MILLIONS)

Bookmark and Share

U.S. commodity-grade animal fats & vegetable oils production to reach 13.3 mt million by 2016

U.S. production of commodity-grade animal fats and major vegetable oils amounted to 13.1 million metric tons in 2010 and is projected to decrease to 12.9 million metric tons in 2011. It is expected to reach 13.3 million metric tons by 2016 at a compound annual growth rate (CAGR) of 0.6% between 2011 and 2016.

Learn about the various types of fat and oil, their production, apparent consumption in foods and industrial products, and related international aspects. Technological issues relating to the manufacture of the products, recent patents awarded for innovations in the industry and profiles of major U.S. producers of fats and oils are provided as well...

Use this report to: 
  • Understand what types of fats are being consumed currently, and where we might expect to see shifts in consumption trends over the foreseeable future and by how much 
  • Learn about the global role, the global production, and end uses of these commodities 
  • Identify key factors that influenced past trends and are projected to contribute to future developments in the industry 
  • Get valuable information for assessing investments in particular technologies of the fats and oils industry.
To provide further information about this report we offer a Complimentary Introduction, available from our Website. To download, simply click here, go to the Table of Contents tab, add the complimentary introduction to your cart, and confirm your order. 

SUMMARY FIGURE
PROJECTED SHARES OF U.S. PRODUCTION OF ANIMAL FATS AND MAJOR VEGETABLE OILS, 2011 AND 2016
(%)
Source: BCC Research

Bookmark and Share

Tuesday, April 17, 2012

Global market for plastics used in electronic enclosures to reach 9.9 billion pounds by 2017


The global market for plastics used inelectronic enclosures was 6.9 billion pounds in 2011. BCC expects this market to reach 7.4 billion pounds by 2012 and to reach 9.9 billion pounds by 2017, increasing at a compound annual growth rate (CAGR) of 6.1%.

Learn about some of the significant changes within the industry and receive information on technologies and applications for electronic enclosure resins. Profiles of major electronic enclosure manufacturers are also covered...
Use this report to:
  • Analyze new developments, particularly the complex scenario of very small enclosures, given that mobile electronic devices have become increasingly smaller and lighter
  • Identify the changes in the market for stationary electronic devices, especially because of the additional protection required for power supplies within units
  • Understand the use of flame retardants for resins used in electronic enclosures to conform to new environmental restrictions related to bromine-based variants
  • Learn about the use of metals in stationary and mobile electronic devices.
To provide further information about this report we offer a Complimentary Introduction, available from our Website. To download, simply click here, go to the Table of Contents tab, add the complimentary introduction to your cart, and confirm your order.


GLOBAL MARKET FOR RESINS FOR STATIONARY AND MOBILE ENCLOSURES BY TYPE OF ELECTRONIC ENCLOSURE, 2011-2017
(MILLION POUNDS)


Source: BCC Research

Bookmark and Share

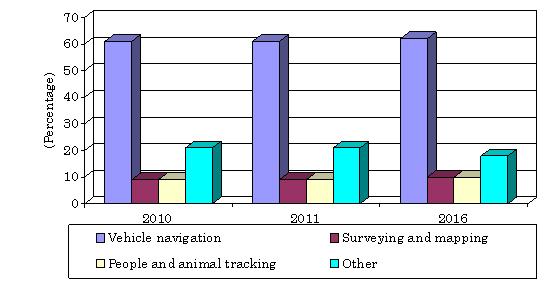
Global market for mobile location technologies to grow to $36.3 billion in 2016

The global market for mobile location technologies reached $22.5 billion in 2010 and $25.1 billion in 2011. It will further grow to $36.3 billion in 2016 for a compound annual growth rate (CAGR) of 7.6% between 2011 and 2016.

Learn about the key new mobile location technologies and applications, including those expected to be commercialized in the 2011 to 2016 time frame; and learn about the current market and future direction of the mobile location technologies market. Profiles of leading industry players are provided as well...
Use this report to:
  • Receive an overview of the global market for mobile positioning technologies, with descriptions of those technologies expected to be commercialized between 2011 and 2016
  • Identify the latest applications and trends in the market for GPS and other mobile location technologies
  • Understand and evaluate the impact of economic, business, demographic, technological, legal/regulatory and other factors that will determine the future market for each of these new technologies
  • Analyze the structure and competitive conditions in the global mobile location technology market.

To provide further information about this report we offer a Complimentary Introduction, available from our Website. To download, simply click here, go to the Table of Contents tab, add the complimentary introduction to your cart, and confirm your order.

GLOBAL MARKET SHARE PROJECTIONS FOR MOBILE LOCATION TECHNOLOGIES BY APPLICATION, 2010-2016
(%)

Bookmark and Share

Thursday, April 12, 2012

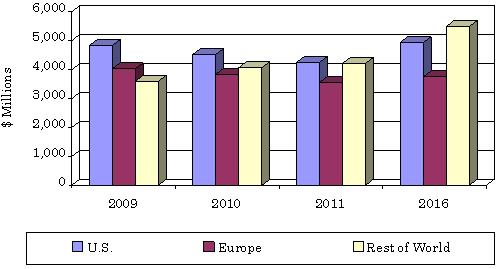
Global market for drugs used to treat liver disease to grow to $14.2 billion by 2016


In 2010, the global market for drugs used to treat liver disease was worth $12.4 billion. The estimated sales for 2011 were approximately $12 billion (excluding protease inhibitors) and are expected to rise at a compound annual growth rate (CAGR) of 3.3% to reach $14.2 billion by 2016.

Learn about the present and future strategies within the liver disease drug market, including market sizes, market leaders, market overview, and various other market factors, as well as the market for end users. Companies that manufacture and sell new and innovative liver disease-related drugs are profiled as well...
Use this report to:
  • Gain an overview of the current and future characteristics of the global market for liver disease drugs, including the market for end users
  • Learn about different categories of liver disease drugs and the various types of liver disease broken down by market shares belonging to leading manufacturers and/or suppliers
  • Gain information regarding different liver disease drugs in response to an increasing need for new and innovative drug treatments
  • Analyze the market leaders, regulatory environment, technology, market projections, and market shares of the liver disease drug industry.
To provide further information about this report we offer a Complimentary Introduction, available from our Website. To download, simply click here, go to the Table of Contents tab, add the complimentary introduction to your cart, and confirm your order.


GLOBAL REVENUE FOR DRUGS USED TO TREAT LIVER DISEASES BY REGION, 2009-2016
($ MILLIONS)


Source: BCC Research

Bookmark and Share