Thursday, May 31, 2012

Global Market for Lightweight Materials in Transportation to Grow to $125.3bn by 2015


The total global consumption of lightweight materials used in transportation equipment was 38.2 million tons/$58.4 billion in 2009. These figures are projected to rise to 46.7 million tons/$95.5 billion in 2010, and 67.7 million tons/$125.3 billion by 2015, at compound annual growth rates (CAGRs) of 7.7% in tonnage terms and 5.6% in value terms between 2010 and 2015.

Learn about the lightweight materials with the greatest commercial potential in transportation applications over the next 5 years (2010 to 2015). Get information on the technical, commercial, and other prerequisites of success in these markets...

Use this report to: 
  • Assess the business opportunities for manufacturers of lightweight materials as they increase their penetration into various transportation markets 
  • Identify the lightweight materials with the greatest global commercial potential in transportation applications over a 5-year forecast period 
  • Make effective business decisions based on an understanding of the technical, commercial, and other prerequisites of success in markets for lightweight materials 
  • Analyze technical, economic, competitive, and other factors that will influence the future consumption of different materials and how well each maintains its market share. 
To provide further information about this report we offer a Complimentary Introduction, available from our Website. To download, simply click here, go to the Table of Contents tab, add the complimentary introduction to your cart, and confirm your order.

SUMMARY FIGURE
TRENDS IN GLOBAL MARKET FOR LIGHTWEIGHT MATERIALS USED IN TRANSPORTATION EQUIPMENT, 2009-2015
(MILLION TONS/$ BILLIONS)

Bookmark and Share

Smart Materials and Their Applications: Technologies and Global Markets

Smart Materials: Technologies and Global Markets
The global market for smart materials in 2010 was $19.6 billion. BCC expects the market to approach $22 billion in 2011 and pass $40 billion by 2016, a compound annual growth rate (CAGR) of 12.8% between 2011 and 2016.
Learn about the principal applications for each type of smart material (including commercial, industrial, medical, research and military applications) and get estimates of the current and projected worldwide market for each type of smart material and application through 2016...
Use this report to:
  • Understand the principal applications for each type of smart material (including commercial, industrial, medical, research and military applications) and assess global markets for these products.
  • Examine the market impact of new materials and applications that are likely to be introduced in the next 5 years.
  • Identify trends and likely application(s) for current and emerging types of smart materials as the basis for developing marketing strategies.
  • Perform a competitive analysis of the manufacturers of smart materials and smart material-based products that are most likely to benefit from emerging trends in the field.
To provide further information about this report we offer a Complimentary Introduction, available from our Website. To download, simply click here, go to the Table of Contents tab, add the complimentary introduction to your cart, and confirm your order.
SUMMARY FIGURE
GLOBAL MARKET FOR FORECAST FOR SMART MATERIALS, 2010-2016
(% OF TOTAL MARKET)
 
Bookmark and Share

Wednesday, May 30, 2012

Global Market for Smart Glass-Based Products to Grow to $4.2 Billion in 2016

The global market for smart glass-based products increased from $883.1 million in 2009 to $1.2 billion in 2010, and was valued at nearly $1.6 billion in 2011. The market is forecast to grow at a compound annual growth rate (CAGR) of 21.6% from 2011 to 2016, reaching global revenues of nearly $4.2 billion in 2016.

Learn about smart glass markets, review smart glass types, materials, and their fabrication processes and also see trends and growth forecasts for the next five years. This report also includes details by sector on applications, current market breakdowns, industry growth and key trends and developments...

Use this report to:
  • Receive an updated review of smart glass markets, including descriptions of types and fabrication technologies 
  • Identify current fields of application for smart glass and investigate emerging applications 
  • Analyze the current global markets for smart glass based on type, application, and region, with growth forecasts through 2016 for each market segment 
  • Identify important technology and market trends within each market segment. 
To provide further information about this report we offer a Complimentary Introduction, available from our Website. To download, simply click here, go to the Table of Contents tab, add the complimentary introduction to your cart, and confirm your order.

SUMMARY FIGURE
GLOBAL MARKET FOR SMART GLASS PRODUCTS, 2009–2016
($ MILLIONS)
Bookmark and Share

Tuesday, May 29, 2012

Global Market for Blood-Brain Barrier Technology to Reach $387 Million by 2015

The global market for blood-brain barrier (BBB) technology for therapeutics amounted to $12.3 million in 2010 and will reach $387 million by 2015, a compound annual growth rate (CAGR) of 99.3%.

Learn about the current status of the global therapeutic market for blood-brain barrier (BBB) technologies, including its growth potential over a 5-year period from 2010 to 2015. BCC analyzes each technology, determines its current market status, examines its impact on future markets, and presents forecasts of growth over the next 5 years. Technological issues, including the latest trends, are discussed...

Use this report to: 
    • Understand the latest research and trends in blood-brain barrier (BBB) technology, drug development, and drug delivery methods 
    • Identify opportunities for investment, alliances, and research collaborations to use technology to cross the BBB, as well as which technologies show the most promise in the growing central nervous system therapeutic market 
    • Evaluate potential opportunities arising from the increasing commercialization of biologics-based drugs that require some sort of BBB technology adaptation 
    • Develop strategies to address the challenges involved in BBB technologies and in developing CNS therapeutics. 
    To provide further information about this report we offer a Complimentary Introduction, available from our Website. To download, simply click here, go to the Table of Contents tab, add the complimentary introduction to your cart, and confirm your order.

    SUMMARY FIGURE
    GLOBAL MARKET FOR BBB TECHNOLOGY FOR THERAPEUTICS, THROUGH 2015
    ($ MILLIONS)

    Bookmark and Share

    Thursday, May 24, 2012

    Global Market for Forensic Products and Services to Grow To $17.2 Billion by 2016

    The global market for Forensic Products and Services in 2010 was nearly $10.1 billion. BCC expects the market to approach $11 billion in 2011 and pass $17.2 billion by 2016, a compound annual growth rate (CAGR) of 9.4% between 2011 and 2016.

    Learn about the forensic science industry products and technologies used to analyze evidence in a crime laboratory as well as other types of evidence and get to know trends in the application of these technologies and products, and measurements and forecasts of market demand through 2016. Company profiles and a patent analysis are provided as well....

    Use this report to: 
      • Understand market dynamics and demand within the forensic science industry and the key objectives in designing for forensic testing
      • Identify and evaluate technology advancements in forensics as well as trends in the application of these technologies and products
      • Make informed business decisions and effective marketing strategies to capture market share from current and future technologies, products, market segments and end markets
      • Assess competitors in terms of technological strengths and weaknesses, relative market share, marketing strengths, and innovative marketing practices.
      To provide further information about this report we offer a Complimentary Introduction, available from our Website. To download, simply click here, go to the Table of Contents tab, add the complimentary introduction to your cart, and confirm your order.

      SUMMARY FIGURE
      MAJOR U.S. FORENSIC PRODUCTS AND SERVICES MARKET SEGMENTS FORECAST, 2010-2016
      ($ MILLIONS)

      Bookmark and Share

      Wednesday, May 23, 2012

      Global Market for Wood-Plastic Composites to Pass 4.6 Million Metric Tons by 2016

      The global market for applications of wood-plastic composites (WPCs), cellulosic plastics, plastic lumber, and natural fiber composites in 2010 was nearly 2.3 million metric tons. BCC expects the market to approach 2.4 million metric tons in 2011 and pass 4.6 million metric tons by 2016, a compound annual growth rate (CAGR) of 13.8% between 2011 and 2016.

      Learn about products such as: wood-plastic composites, cellulosic plastics, plastic lumber and natural fiber composites. Critical issues included in detail are technologies, production, requisite properties required for each application, costs and pricing, marketing, competitive company strategies, distribution, product standards and testing, and the claims and counter-claims of companies producing these products...

      Use this report to: 
      • Learn about the products such as WPCs their applications, advantages and disadvantages 
      • Identify major trends within the global market for applications of these products 
      • Track growth in many sectors of the wood-plastic composites industry 
      • Evaluate technological advancements in producing these products 
      • Assess major participants, future growth potential, as well as the technologies and standards crucial to understanding the industry.
      To provide further information about this report we offer a Complimentary Introduction, available from our Website. To download, simply click here, go to the Table of Contents tab, add the complimentary introduction to your cart, and confirm your order.

      SUMMARY FIGURE
      GLOBAL MARKET FOR APPLICATIONS OF WPCS, CELLULOSICS, PLASTIC LUMBER, AND NATURAL FIBER COMPOSITES, 2008-2016
      (METRIC TONS)
      Bookmark and Share

      Global remote sensing technologies market to grow to $12.4 billion in 2017

      The global remote sensing technologies market is estimated to reach $8.3 billion in 2011. It is expected to reach $9.1 billion in 2012 and will further grow to $12.4 billion by 2017 at a compound annual growth rate (CAGR) of 6.4%.

      Learn about the remote sensing industry, specifically basic types of remote sensing instruments, platforms and technologies, and important applications such as weather forecasting, intelligence gathering, climate change, and public health. Patent analysis and company profiles are provided as well...

      Use this report to:

      • Receive an overview of the remote sensing industry, with descriptions of GPS, GIS, remote sensing technologies, important applications including weather forecasting, intelligence gathering, climate change, and public health
      • Determine major remote sensing platforms, key instruments and applications that account for the bulk of the industry
      • Analyze global market trends in 20 application areas for remote sensing, estimates for 2011 and 2012, and projections for 2017
      • Understand major patents in the industry.
      To provide further information about this report we offer a Complimentary Introduction, available from our Website. To download, simply click here, go to the Table of Contents tab, add the complimentary introduction to your cart, and confirm your order.

      VALUE OF REMOTE SENSING PRODUCTS, BY PLATFORM, 2011-2017
      ($ BILLIONS)


      Bookmark and Share

      Tuesday, May 22, 2012

      Global market for autoimmune treatments to grow to $55 billion by 2016

      The global market for autoimmune treatments reached $34 billion in 2010 and is expected to reach $38.9 billion by 2011.  It will further grow to $55 billion by 2016 at a compounded annual growth rate (CAGR) of 7.2%. The U.S is the largest market for autoimmune treatments and holds a 43% share of the global market. It will sustain its position and will hold a 44% share in 2016.

      Learn about the products and therapies currently used or under development for treatment of a variety of autoimmune diseases. Also learn about the global autoimmune market by product segment, disease, and geographical region. Company profiles are provided as well...

      Use this report to:
      • Receive in-depth analysis and forecasts of the global autoimmune products market
      • Determine products and therapies currently used or under development for treatment of a variety of autoimmune diseases
      • Understand the autoimmune market by disease and by treatment, with supporting tables and figures to illustrate projected growth
      • Analyze information on autoimmune treatment assistive technologies, patents and regulations.
      To provide further information about this report we offer a Complimentary Introduction, available from our Website. To download, simply click here, go to the Table of Contents tab, add the complimentary introduction to your cart, and confirm your order.

      GLOBAL MARKET FOR AUTOIMMUNE TREATMENTS BY GEOGRAPHICAL AREA, 2011 AND 2016
      (%)


      Bookmark and Share

      Market for Microscopes and Accessories to Reach $4.1 Billion Globally in 2016

      The global market for microscopes and accessories was worth about $3.1 billion in 2010. Sales are projected to exceed $3.2 billion in 2011 and $4.1 billion in 2016, a compound annual growth rate (CAGR) of 5% for 2011 to 2016.

      Learn about the various types of microscopes and microscope accessories including: optical (light) microscopes, electron microscopes, scanning probe microscopes and other types of microscope (e.g., focused ion beam, confocal).  Get to know  the global market trends, major end uses, applications and recent developments in microscopy technologies. Comprehensive company profiles and patent analysis are provided as well...

      Use this report to: 
      • Identify market structures for various types of microscopes and microscope accessories
      • Understand the technology and innovation behind microscopy development
      • Evaluate technical and other challenges that must be overcome for the market to realize its full potential
      • Quantify key demand drivers and to project future demand for different types of microscopes.
      To provide further information about this report we offer a Complimentary Introduction, available from our Website. To download, simply click here, go to the Table of Contents tab, add the complimentary introduction to your cart, and confirm your order.
      SUMMARY FIGURE
      MARKET FOR MICROSCOPES, ACCESSORIES, AND SUPPLIES, 2010-2016
      ($ MILLIONS)

      Bookmark and Share

      Thursday, May 17, 2012

      North American market for inorganic nanoporous and microporous adsorbents to grow to $2.9 billion by 2017

      The North American market for inorganic nanoporous and microporous adsorbents reached $2.2 billion in 2011. It is expected to reach nearly $2.4 billion in 2012 and it will further grow to $2.9 billion by 2017, a compound annual growth rate (CAGR) of 4.3%.

      Learn about the technological, economic, and environmental considerations of the inorganic microporous adsorbent industry. This report also covers the latest technology developments, commercial applications and profiles of key manufacturers...

      Use this report to:
      • Receive an overview of the global market for inorganic nanoporous and microporous adsorbents including information on recent advances in microporous inorganic adsorbent materials manufacturing and its commercial applications
      • Receive information on major types of adsorbents, including key physical and chemical properties, raw materials, and manufacturing processes
      • Analyze trends in technology and the impact of government regulations on the industry
      • Receive outlines of the structural dynamics of the adsorbent industry and comprehensive company profiles of major players.

      To provide further information about this report we offer a Complimentary Introduction, available from our Website. To download, simply click here, go to the Table of Contents tab, add the complimentary introduction to your cart, and confirm your order.

      NORTH AMERICAN MARKET GROWTH OF INORGANIC NANOPOROUS AND MICROPOROUS ADSORBENTS BY TYPE, 2011-2017
      ($ MILLIONS)
       

      Bookmark and Share

      Global Solid Oxide Fuel Cell Market Is Projected To Reach $530 Million By 2016

      The global solid oxide fuel cell market in 2011 will be worth more than $380 million, up from $360 million in 2010. It is projected to reach $530 million by 2016, a compound annual growth rate (CAGR) of 6.9% between 2011 and 2016 under a consensus scenario.

      Learn about the position of solid oxide fuel cell (SOFC) technology within the larger field of fuel cells. Also learn about the market drivers, market applications, patents and technologies for materials, components, and safety needs for SOFC. Industry structure and company profiles are provided as well...


      Use this report to: 
      • Analyze components of SOFC price and efficiency advantages 
      • Get valuable information for assessing investments in particular technologies of solid oxide fuel cells 
      • Discuss energy policies and their impact in the near to mid-term future 
      • Identify and evaluate technology advancements in SOFC and the applications of these technologies and products.
      To provide further information about this report we offer a Complimentary Introduction, available from our Website. To download, simply click here, go to the Table of Contents tab, add the complimentary introduction to your cart, and confirm your order. 

      GLOBAL SOFC MARKET SUMMARY BY TECHNOLOGY, BY APPLICATION, CONSENSUS SCENARIO
      ($ MILLIONS)
      Source: BCC Research

      Bookmark and Share

      Graphene: Technologies, Applications, and Markets


      Graphene: Technologies, Applications, and Markets
      BCC expects the first commercially significant sales of graphene products to develop before 2015 when the market is projected to be as large as $67 million. The global market for graphene-based products should start to take off after 2015, reaching nearly $675 million by 2020.
      Learn about the graphene technologies and applications with the greatest commercial potential in the 2010 to 2020 time frame. Get information on the market drivers and obstacles to their successful commercialization, projections of future sales and patents...
      Use this report to:
      • Identify emerging graphene technologies and applications that are most likely to achieve significant commercial sales in the next 5 to 10 years
      • Understand the market drivers and obstacles to the successful commercialization of graphene techologies
      • Learn about and take advantage of government and corporate research funding for different technologies and applications
      • Evaluate the competitive profiles of companies that are producing or developing commercial graphene applications.
      To provide further information about this report we offer a Complimentary Introduction, available from our Website. To download, simply click here, go to the Table of Contents tab, add the complimentary introduction to your cart, and confirm your order.
      SUMMARY FIGURE
      GLOBAL MARKET FOR GRAPHENE-BASED PRODUCTS, 2009-2020
      ($ MILLIONS)
      Bookmark and Share

      Wednesday, May 16, 2012

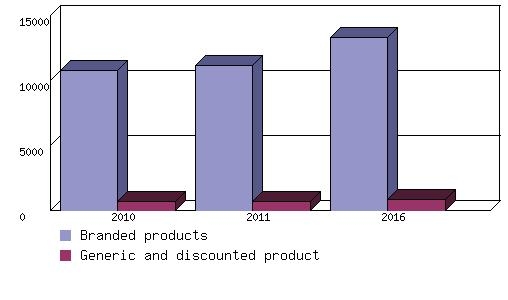
      The global HIV/AIDS market, including branded products and generics, was valued at $11.3 billion in 2010. This market is expected to reach $11.8 billion in 2011 and increase at a 4.6% compound annual growth rate (CAGR) over the 2011-2016 forecast period to reach $14.1 billion in 2016.

      Learn about the market for products used in the management of HIV infection and AIDS. Important trends are identified and sales’ forecasts by product categories and major country markets are provided through 2016...

      Use this report to: 
      • Quantify and qualify the current market for products used in the management of HIV infection and AIDS
      • Assess the regulatory environment, healthcare policies, demographics, and other factors that directly affect the HIV/AIDS market
      • Gain insight into the latest treatment and diagnostic options and their cost implications in countries of widely varying economic status, and evaluate promising new research directions
      • Identify important market forces and trends that directly affect the HIV/AIDS market and make strategic decisions about how to operate in this dynamic and continually evolving marketplace. 
      To provide further information about this report we offer a Complimentary Introduction, available from our Website. To download, simply click here, go to the Table of Contents tab, add the complimentary introduction to your cart, and confirm your order. 

      SUMMARY FIGURE
      ARV MARKET ESTIMATES AND FORECASTS, 2010-2016
      ($ MILLIONS)

      Bookmark and Share

      North American market for high-performance ceramic coatings to grow to $2 billion by 2016

      The North American market for high-performance ceramic coatings was worth $1.3 billion in 2010 and $1.4 billion in 2011. It is expected to grow to more than $2 billion by 2016, a projected five-year compound annual growth rate (CAGR) of 7.4%.

      Learn about the types of materials used for high-performance ceramic coatings as well as their properties, applications, economics, current markets and trends, and technologies. Profiles of current industry players, including suppliers of equipment, consumables, coating service providers and users are provided as well...

      Use this report to:
      • Receive an industry overview of ceramic coatings delivered by thermal spray, physical vapor deposition (PVD), chemical vapor deposition (CVD) and other techniques --including spraying/dipping, sol gel, micro-oxidation, packed diffusion, ionic beam surface treatment and laser-assisted techniques
      • Determine the current size and future growth of the North American markets for ceramic thermal spray, PVD, CVD and other coatings services
      • Receive a technology overview including material types, properties and applications for ceramic coatings
      • Analyze domestic competition among companies within each of the ceramic coating service segments.

      To provide further information about this report we offer a Complimentary Introduction, available from our Website. To download, simply click here, go to the Table of Contents tab, add the complimentary introduction to your cart, and confirm your order.

      MARKET SHARE OF NORTH AMERICAN HIGH-PERFORMANCE CERAMIC COATING TECHNOLOGIES, 2010-2016
      (% TOTAL MARKET)
       

      Bookmark and Share

      Tuesday, May 15, 2012

      Congestive Heart Failure Global Pharmaceuticals Market to Reach $18.6 Billion in 2016

      The global market for congestive heart failure pharmaceuticals was valued at nearly $11.2 billion in 2010. This market is expected to reach $12.2 billion in 2011 and $18.6 billion in 2016, a compound annual growth rate (CAGR) of 8.9% between 2011 and 2016.

      Learn about global market trends, various categories of products, current products on the market and market drivers for congestive heart failure treatment. Company profiles are provided as well...

      Use this report to: 
      • Receive in-depth analysis about the congestive heart failure market, its relationship to the healthcare industry and its participants
      • Analyze trends specific to geographies that include America, Europe, Asia and Rest of the World/Emerging markets (Australia, India, Israel, and Russia)
      • Understand new and currently used modalities in all facets of the congestive heart failure market
      • Determine the key players along with their market share. 
      To provide further information about this report we offer a Complimentary Introduction, available from our Website. To download, simply click here, go to the Table of Contents tab, add the complimentary introduction to your cart, and confirm your order. 

      TOTAL GLOBAL MARKET SIZE AND FORECAST FOR CHF PHARMACEUTICALS, 2010-2016
      ($ MILLIONS)
      Source:  BCC Research


      Bookmark and Share

      Global markets for media, sera and reagents in biotechnology to grow to $4.2 billion by 2016

      The global market for media, sera and reagents used in biotechnology was valued at $2.3 billion in 2009, $2.5 billion in 2010 and is estimated to have reached nearly $2.8 billion at the end of 2011. The market is expected to reach $4.2 billion by 2016, a compound annual growth rate (CAGR) of 8.8%.

      Learn about the present and future strategies within the media and sera market, including reagents used in biotechnology. Also learn about the strength and weaknesses of the different types of media used in light of the new technologies, growing competition and changing customer needs. Applications for the cell culture industry and patent analysis are provided as well...

      Use this report to:
      • Receive an overview of the current and future characteristics of the global market for media, sera and the reagents used in biotechnology
      • Receive information on types of cell cultures, the products from cell culture technology and advantages and disadvantages concerning the use of various types of media
      • Receive information on applications for the cell culture industry—media, sera and reagents used in biotechnology with an emphasis on the usage in the research, production and contract segments
      • Receive information on cell culture industry structure and significant patents in each segment.

      To provide further information about this report we offer a Complimentary Introduction, available from our Website. To download, simply click here, go to the Table of Contents tab, add the complimentary introduction to your cart, and confirm your order.

      GLOBAL REVENUES FROM MEDIA, SERA AND REAGENTS USED IN THE BIOTECHNOLOGY MARKET, 2009-2016
      ($ MILLIONS)
       

      Bookmark and Share

      Thursday, May 10, 2012

      Global market for thin film materials to grow to $14.9 billion by 2016

      The global market for thin film materials increased from $6.9 billion in 2009 to nearly $8.4 billion in 2010 and it is estimated to be valued at nearly $9.3 billion in 2011. BCC projects this market to reach nearly $14.9 billion by 2016 at a compound annual growth rate (CAGR) of 10%.

      Learn about the most advanced processes employed for the fabrication of thin and ultrathin films worldwide. Identify the most common materials used for each thin film deposition process. Detailed company profiles of the top industry players are also provided...

      Use this report to:
      • Gain a detailed overview of the current market and an impartial analysis of prospects for future growth, with a focus on the raw materials used to produce thin films and nanofilms
      • Learn about new technological developments in the fabrication of thin films
      • Identify important technology and market trends within each market segment
      • Examine industry structure worldwide, including leading manufacturers and their products, company profiles and relative market shares of the top players
      • Determine trends in U.S. patents and worldwide patents issued during the most recent years.

      To provide further information about this report we offer a Complimentary Introduction, available from our Website. To download, simply click here, go to the Table of Contents tab, add the complimentary introduction to your cart, and confirm your order.

      GLOBAL MARKET FOR THIN FILM MATERIALS, 2009-2016
      ($ MILLIONS)


      Bookmark and Share

      North american residential roofing market to grow to $6.6 billion by 2016

      The North American residential roofing market reached $4.8 billion in 2010 and $5 billion in 2011. It is expected to grow to $6.6 billion by 2016, a compound annual growth rate (CAGR) of 5.7%.

      Learn about all residential roofing products used in the North American residential roofing market with projections for each product type through 2016. Profiles of leading North American residential roofing manufacturers are provided as well...

      Use this report to:
      • Receive a comprehensive analysis of the North American residential roofing market, market trends, and forecasts for the market
      • Receive an overview of the residential roofing products used in the U.S. and Canadian markets
      • Receive information about the latest product developments, material and technology enhancements
      • Receive information on industry structure, competitive analysis and various distribution channels and their dynamics.
      To provide further information about this report we offer a Complimentary Introduction, available from our Website. To download, simply click here, go to the Table of Contents tab, add the complimentary introduction to your cart, and confirm your order.

      NORTH AMERICAN RESIDENTIAL ROOFING MARKET VALUE, 2010-2016
      ($ BILLIONS)


      Bookmark and Share

      Global Markets for Dental Consumables & Prosthetics to Reach $18.5bn in 2015

      The overall value of the global dental consumables and prosthetics market was worth $15.9 billion in 2010, up from $15.7 billion in 2009. The market is estimated to reach $18.5 billion in 2015, at a compound annual growth rate (CAGR) of 3.1% over the forecast period.

      Learn about the products included in the dental consumables and prosthetics markets and get detailed estimates of market size and growth and analyses of markets and competitive environments. The study includes information regarding significant products, players, issues, trends, and other information affecting the dental industry...

      Use this report to: 
      • Understand how new product development, changing environments, and shifting trends in consumer demand are affecting the competitive landscape of the dental consumables and prosthetics market 
      • Evaluate markets in the general segments of preventive, treatment and restorative/cosmetic consumables and develop business growth strategies to capture your market share 
      • Examine market drivers such as education efforts directed at both consumers and professionals, as well as product development efforts such as implant dentistry and minimally invasive techniques 
      • Validate internal marketing plans based on an analysis of detailed information about product categories, uses of products, forecasts, and competitive analyses.
      To provide further information about this report we offer a Complimentary Introduction, available from our Website. To download, simply click here, go to the Table of Contents tab, add the complimentary introduction to your cart, and confirm your order. 

      SUMMARY FIGURE
      GLOBAL DENTAL CONSUMABLES MARKET ANALYSIS BY PRODUCT SEGMENT, 2008-2015
      ($ MILLIONS)
      Source: BCC Research
      Bookmark and Share

      Wednesday, May 9, 2012

      Security technologies for transportation markets to reach $5.9 billion by 2015

      The global security technologies for transportation markets reached $2.3 billion in 2010 and is expected to reach $5.9 billion by 2015 at a compound annual growth rate (CAGR) of 20.4%.

      Learn about the global market trends for the security solution market used exclusively in the transportation sector. Also learn about the most important issues surrounding security solutions for transportation markets such as pricing analysis, competitive dynamics, recent developments, and market dynamics at macro and micro levels. Key player profiles and patent analysis are provided as well...

      Use this report to: 
      • Gain insights about the global security solutions technology market and  recent patents of top technologies
      • Identify key transportation security solution technologies, applications, and market opportunities that promise long term growth  
      • Determine market dynamics and respective impacts in the short, medium and long term periods
      • Understand trends specific to geographies that include North America and Latin America (NALA); Europe, Middle East, and Africa (EMEA); and Asia and the Pacific (APAC). 
      To provide further information about this report we offer a Complimentary Introduction, available from our Website. To download, simply click here, go to the Table of Contents tab, add the complimentary introduction to your cart, and confirm your order.

      SUMMARY FIGURE
      GLOBAL SECURITY SOLUTIONS FOR THE TRANSPORTATION MARKET BY TECHNOLOGIES, 2008-2015
      ($ MILLIONS)

      Source: BCC Research
      Bookmark and Share

      Market for organic light-emitting diodes to grow to $5.2 billion globally by 2016

      The global OLED market was nearly $3 billion in 2010. BCC expects the market to grow to more than $3 billion in 2011 and $5.2 billion by 2016, a compound annual growth rate (CAGR) of 11.6% between 2011 and 2016.

      Learn about the global market for organic light-emitting diodes in electronic displays and lighting devices and the various technologies used in OLEDs with their current and future market trends. Also learn about the government and industry support for research and development in the major regions of the world. Key players, industry's competitiveness and company profiles are provided as well...

      Use this report to:
      • Gain insights about the OLED market
      • Assess the market potential for light-emitting diodes made with organic materials, particularly for displays and lighting applications
      • Analyze the current global manufacturing and consumption patterns of OLEDs by region
      • Learn about various technologies used in the OLED, advantages and limitations of each kind of display and lighting technology, new technology developments and patent analysis.
      To provide further information about this report we offer a Complimentary Introduction, available from our Website. To download, simply click here, go to the Table of Contents tab, add the complimentary introduction to your cart, and confirm your order.

      VALUE OF OLED SHIPMENTS, 2010-2016
      ($ 000)
       

      Bookmark and Share

      Tuesday, May 8, 2012

      Global Market for Sludge Treatment and Odor Control Equipment to Grow to $7 Billion by 2017

      The global sludge treatment and odor control equipment market was worth $5.3 billion in 2011 and is forecast to reach $5.5 billion in 2012. The compound annual growth rate (CAGR) during the forecast period, 2012 to 2017, is estimated to be 4.7%, when sales are projected to reach $7 billion by 2017.

      Learn about the global sludge treatment and odor control equipment market, including systems for sludge digestion, sludge dewatering, sludge drying, and physical, chemical and biological odor control technologies. Government legislation and company profiles are provided as well...

      Use this report to:
      • Gain an understanding of the sludge treatment and odor control market, regulations affecting these markets, market trends and competitive structures within these markets
      • Analyze the global market and developments in municipal and industrial wastewater sludge treatment equipment and wastewater/sludge-based odor control equipment
      • Learn about the current issues affecting the industry, equipment types, legislation relevant to the markets and end user requirements
      • Profile companies that are active in various market sectors.
      To provide further information about this report we offer a Complimentary Introduction, available from our Website. To download, simply click here, go to the Table of Contents tab, add the complimentary introduction to your cart, and confirm your order.

      SUMMARY FIGURE
      GLOBAL MARKET SIZE AND GROWTH FOR SLUDGE TREATMENT AND ODOR CONTROL EQUIPMENT, BY SEGMENT, 2005–2017
      ($ MILLIONS)
      Source: BCC Research
      Bookmark and Share

      Global pharmaceutical excipients market to grow to $6.7 billion by 2016

      The global pharmaceutical excipients market was estimated to be worth $4.6 billion in 2010. The market’s value is forecast to be $4.9 billion in 2011 and $6.7 billion by 2016, a compound annual growth rate (CAGR) of 6.5% between 2011 and 2016.

      Learn about the global excipients industry with detailed analysis of the current market and a forecast of what the market will look like in 5 years. Also learn about the technological, regulatory, economic, and political issues related to excipients. Industry structure and company profiles are provided as well...

      Use this report to:
      • Gain insights about the global Excipients Market
      • Analyze the current excipients market and forecast the market for the next 5 years
      • Identify excipients being used, quantify global market volume, and track important developments
      • Understand the structure of the industry, its driving forces, and gain access into active companies
      • Analyze the technological, regulatory, economic, and political issues related to the excipients market.
      To provide further information about this report we offer a Complimentary Introduction, available from our Website. To download, simply click here, go to the Table of Contents tab, add the complimentary introduction to your cart, and confirm your order.

      GLOBAL EXCIPIENTS MARKET, 2011 AND 2016
      ($ MILLIONS)
       

      Bookmark and Share

      Thursday, May 3, 2012

      Global Demand for Robots and Robot-Related Products to Reach $30 Billion by 2016

      The global demand for robots and robot-related products was worth around $21 billion in 2010. The market is expected to grow to nearly $22 billion in 2011 and $30 billion by 2016, a compound annual growth rate (CAGR) of 6.7% between 2011 and 2016.

      Learn about the demand of the global and country specific market for six basic types of robots including: industrial, domestic service, professional service, security, space, and military robots.  Get to know their components, basic and advanced technology and their applications. Key players and patent analysis are provided as well...

      Use this report to:
      • Learn about the key developments in robotics that have occurred since 2009 and forecasts for the industry on a global, regional, and industry-segmented basis
      • Identify important market forces and trends that directly affect the robotics market
      • Estimate the demand for robots in the four major marketing regions: North America, the European Union, the Asian region, and Other Markets
      • Know about six major types of robots, 26 end-user applications or tasks that robots perform.
      To provide further information about this report we offer a Complimentary Introduction, available from our Website. To download, simply click here, go to the Table of Contents tab, add the complimentary introduction to your cart, and confirm your order.

      SUMMARY FIGURE
      DEMAND FOR ROBOTS, 2009-2016
      ($ MILLIONS)
      Source: BCC Research
      Bookmark and Share

      Global endoscopy devices market to grow to $33.7 billion by 2016

      The global endoscopy market was approx $23.3 billion in 2010. The projection for 2011 is nearly $24.8 billion, and this is anticipated to increase to $33.7 billion by 2016 at a compound annual growth rate (CAGR) of 6.4%.

      Learn about the current and future endoscopy market by product, disease category, company, and geography. The report also includes analysis of the leading competitors, as well as emerging companies in the current worldwide endoscopy market...

      Use this report to:
      • Understand the global markets for endoscope products by their various applications and identify trends in innovation and sales in these markets through 2016
      • Evaluate and quantify the current market size for specific endoscopic technologies within the growing biomedical/pharmaceutical technology market
      • Learn about the major endoscopy applications, technologies, geographies, and factors influencing the demand for endoscopy services and products
      • Learn about a changing market dynamic, the emerging players and technologies, strategies for accessing these emerging markets, and specific disease segments and geographies in order to allow allocation of resources.
      To provide further information about this report we offer a Complimentary Introduction, available from our Website. To download, simply click here, go to the Table of Contents tab, add the complimentary introduction to your cart, and confirm your order. 

      TOTAL ENDOSCOPY MARKET, BY SEGMENT, 2009-2016
      ($ MILLIONS)

      Bookmark and Share

      Global market for bioplastics to grow to 3.7 million metric tons by 2016

      The global use of bioplastics was 0.64 million metric tons in 2010 and 0.85 million metric tons in 2011. BCC expects that the use of bioplastics will increase up to 3.7 million metric tons by 2016, a compound annual growth rate (CAGR) of 34.3%.

      Learn about the various types of bioplastics, trends, and detailed forecasts of demand by region and projected use by type of application-- such as packaging, automotive, consumer goods and general industrial. Profiles of the most important suppliers of bioplastics are provided as well...

      Use this report to:
      • Learn about the various types of bioplastics that are available in the market
      • Identify trends that will affect use of bioplastics and their major end-use application markets
      • Analyze and forecast specific end markets for bioplastics by material types, with sections devoted to each type of renewably sourced plastic
      • Learn about renewable resources to create monomers that replace petroleum-based monomers, such as polyester and polyethylene that use feedstocks made from sugar cane.

      To provide further information about this report we offer a Complimentary Introduction, available from our Website. To download, simply click here, go to the Table of Contents tab, add the complimentary introduction to your cart, and confirm your order.

      USE OF BIOPLASTICS BY GLOBAL REGION, 2009-2016
      (METRIC TONS)
       
       
      Bookmark and Share

      Wednesday, May 2, 2012

      Total Market for Gas-To-Liquids Products to Grow to $6.8 Billion by 2017

      The total market value of gas to liquids (GTL) products was $4.4 billion in 2010 and $4.5 billion in 2011. BCC projects this market will increase from $4.6 billion in 2012 to $6.8 billion by 2017, a CAGR of 8.1%.

      Learn about all areas of the GTL market, including current and future technologies, product types, and market segments/end markets. This report, which is divided into seven sections, assesses the demand and costs of GTL processes in the chemical and energy production markets. Major companies involved in GTL processes and their activities are identified as well...

      Use this report to:
      • Critically evaluate the most dynamic and path breaking aspects of GTL technology
      • Identify uses of GTL processes such as producing ultraclean diesel fuels or other high-quality chemical products like waxes
      • Quantify demand for GTL technology by output, application, and production
      • Focus on individual company initiatives with their technological strengths and weaknesses, market shares, marketing strengths, and innovative marketing practices. 
      To provide further information about this report we offer a Complimentary Introduction, available from our Website. To download, simply click here, go to the Table of Contents tab, add the complimentary introduction to your cart, and confirm your order.

      SUMMARY FIGURE
      MARKET VALUE FORECAST OF PRODUCTS PRODUCED VIA GTL WITH COMPARISONS TO CTL AND BTL, 2010-2017
      ($ BILLIONS)
       Source: BCC Research
      Bookmark and Share

      Global market for synthetic biology to grow to $10.8 billion by 2016

      The global value of the synthetic biology market reached $1.1 billion in 2010. It is expected to reach $1.6 billion in 2011 and it will further grow to $10.8 billion by 2016, increasing at a compound annual growth rate (CAGR) of 45.8%.

      Learn about the synthetic biology products market potential by product type and end use market segments. Also learn about synthetic biology technologies, growth forces, market applications, industry structure and competitive dynamics, future market potential, and product sales forecasts for the period 2011 through 2016. The main companies in these fields are highlighted as well...

      Use this report to:
      • Receive a comprehensive analysis of the emerging synthetic biology industry, with an emphasis on products and technologies that are commercially important in the 2011-2016 time frame
      • Analyze the synthetic biology industry structure, competition, and intellectual property landscape
      • Determine the specific applications and global market forecast for synthetic biology products over a 5-year period from 2011 to 2016
      • Analyze growth factors, companies and industry alliances, and key segments of the industry.
      To provide further information about this report we offer a Complimentary Introduction, available from our Website. To download, simply click here, go to the Table of Contents tab, add the complimentary introduction to your cart, and confirm your order.

      GLOBAL VALUE OF SYNTHETIC BIOLOGY MARKET, BY PRODUCT TYPE, 2010-2016
      ($ MILLIONS)
       

      Bookmark and Share

      Tuesday, May 1, 2012

      Global market for commercial biotechnology separation systems to grow to $26.7 billion by 2016

      The global market for commercial biotechnology separation systems was about $12.1 billion in 2010 and is expected to reach $14.4 billion by the end of 2011. The market is expected to grow at a compound annual growth rate (CAGR) of 13.1%, reaching a market value of nearly $26.7 billion by 2016.

      Learn about separation systems for the commercial biotechnology market broken down into major segments of liquid chromatography, centrifugation, membrane filtration, electrophoresis, and niche separations. Learn about important technologies, and the latest advancements in the industry and competitive environment. Company profiles are provided as well...

      Use this report to:
      • Receive detailed analysis of the various segments of the market, new applications for separation technology, and overall industry trends
      • Examine the separation process for a variety of biomolecules, including proteins, RNA, and DNA
      • Understand government issues and regulations in the market
      • Determine the structure of the industry and its competitive landscape through information on patents, emerging players and their strategies.
      To provide further information about this report we offer a Complimentary Introduction, available from our Website. To download, simply click here, go to the Table of Contents tab, add the complimentary introduction to your cart, and confirm your order.

      GLOBAL MARKET FOR COMMERCIAL BIOTECH SEPARATION SYSTEMS BY METHOD OF SEPARATION, 2011 AND 2016
      ($ MILLIONS)
       

      Bookmark and Share

      Global Market for the Physical Vapor Deposition Industry to Grow to $15 Billion by 2016

      The global market for the PVD industry was $9.2 billion in 2010 and $9.9 billion in 2011. BCC projects this market to reach nearly $15 billion by 2016 at a compound annual growth rate (CAGR) of 8.5% between 2011 and 2016.

      Learn about the current position of PVD technologies and materials in eight major industries; and within each industry, get an overview of key applications, the advantages of using PVD, an analysis of market factors that will impact demand, shipments for 2010 and 2011, and estimated shipments for 2016. Profiles of major players in the industry are provided as well...

      Use this report to:
      • Gain an overview of deposition technologies and future trends, along with global industry structure, including leading manufacturers of equipment and service providers 
      • Learn about the current status of the global market for PVD equipment, material deposited by the process and deposition services 
      • Assess the worldwide growth potential for PVD technologies from 2010 through 2016 
      • Identify the status of the industry in relation to the continuing global economic and currency problems and the impact they have on equipment demand.
      To provide further information about this report we offer a Complimentary Introduction, available from our Website. To download, simply click here, go to the Table of Contents tab, add the complimentary introduction to your cart, and confirm your order.

      SUMMARY FIGURE
      GLOBAL VALUE OF THE PVD INDUSTRY, 2010-2016
      ($ MILLIONS)
       Source: BCC Research
      Bookmark and Share